Product Design
Energy Analytics Platform: Plant Overview
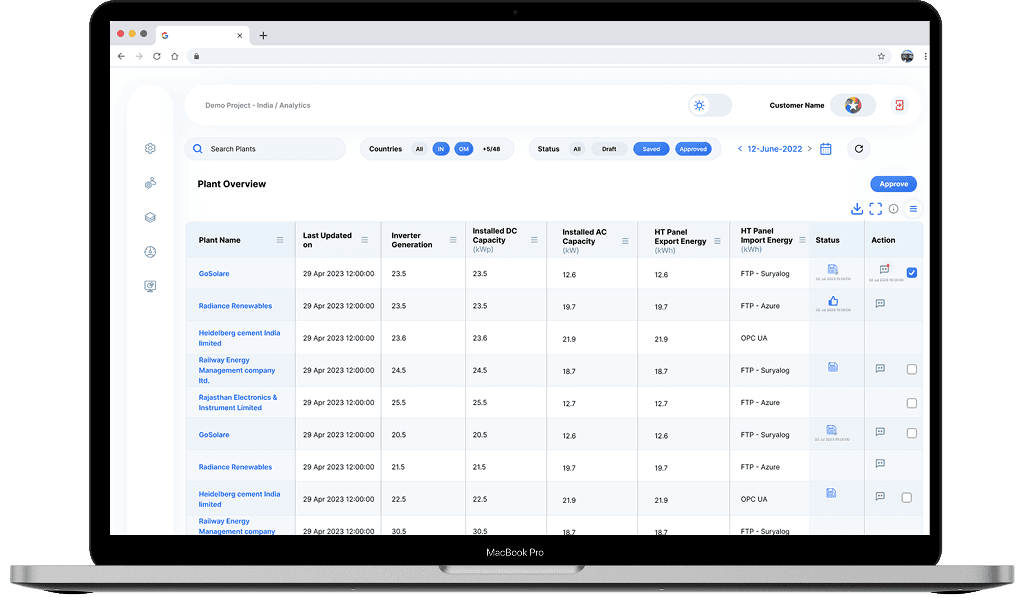
Designed the inaugural Plant Overview and Reporting Dashboard for Prescinto's AI-powered clean energy platform. This was a greenfield project focused on establishing the core Information Architecture for enterprise clients. The goal was to transform complex, multi-plant energy generation data into a highly efficient, single-screen reporting tool. My work focused on balancing data density with clarity, ensuring operators could efficiently filter, monitor statuses (like Draft/Approved), and take immediate action on hundreds of assets.
Year :
2023
Industry :
Renewable Energy, Industrial IoT (IIoT), Solar Analytics
Client :
Internal Project
Project Duration :
3 weeks
Granular Control Over Maintenance Workflows
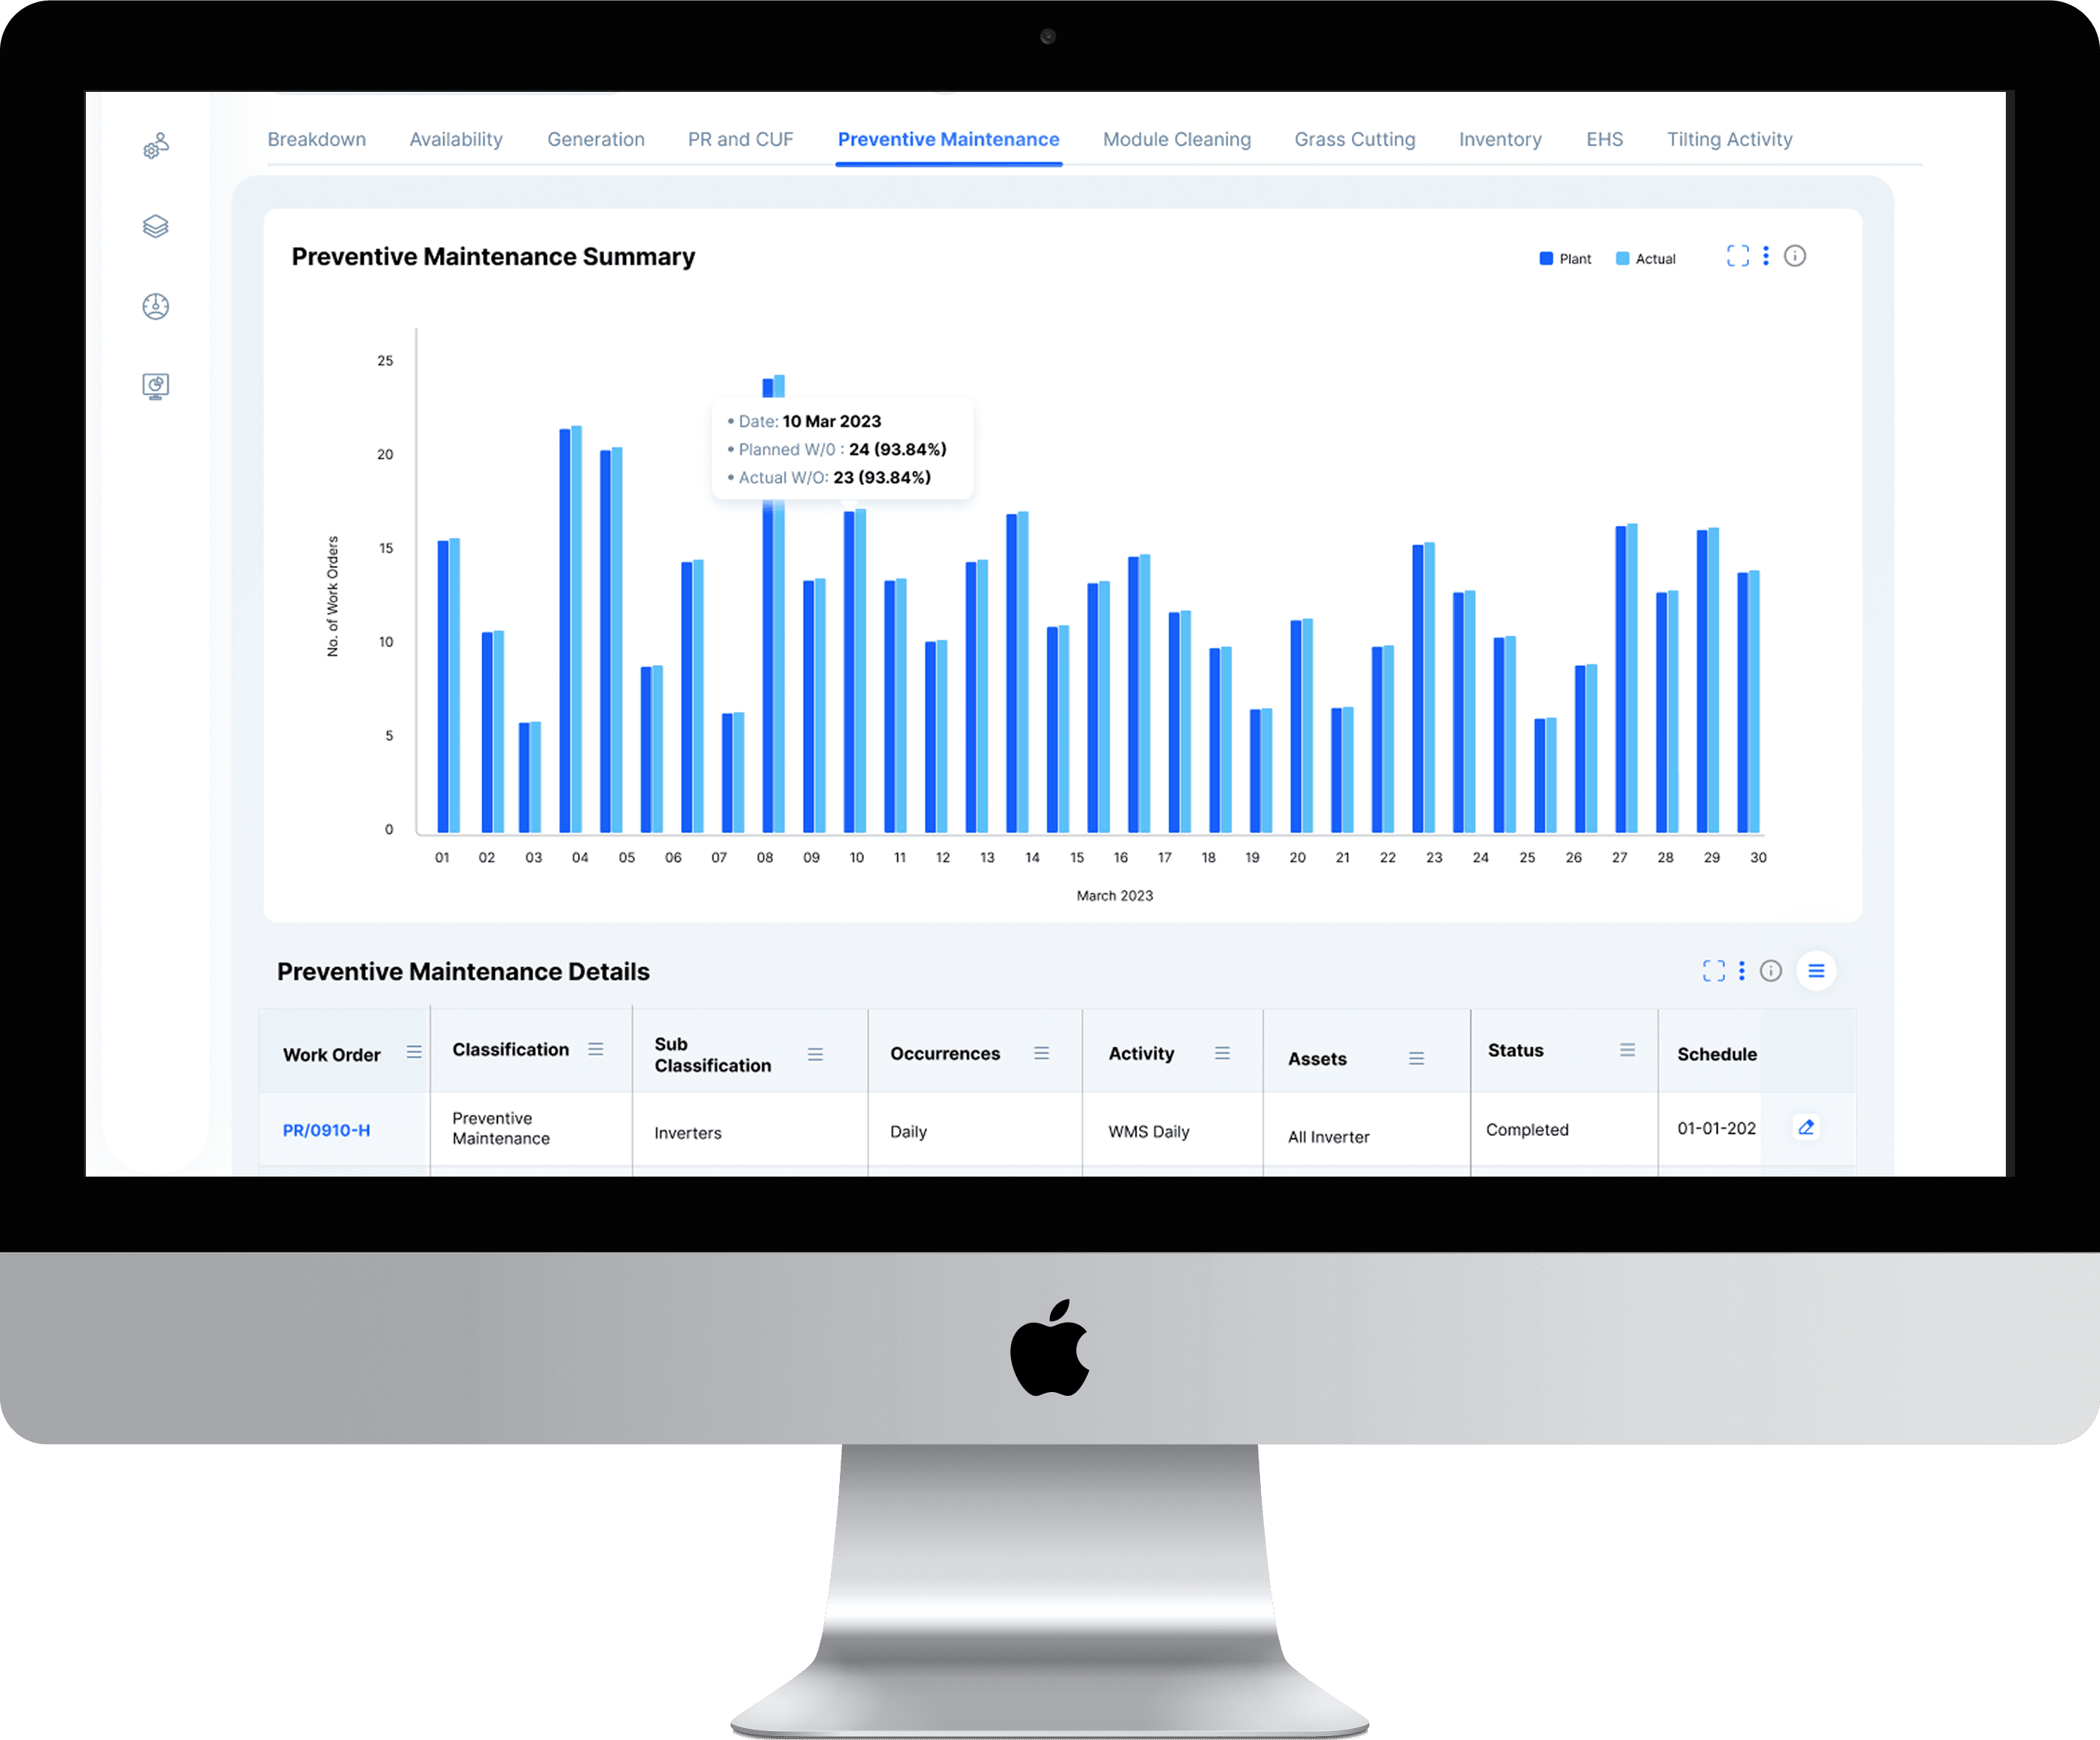
The Preventive Maintenance module was designed to shift maintenance teams from reactive fixes to proactive planning. The dashboard utilizes a dual visualization approach:
Summary Chart: The bar chart provides a quick visual comparison between Planned Work Orders (W/O) and Actual Completed W/O over time, directly tying design to team accountability.
Detailed Table & Advanced Filtering: The table below allows maintenance supervisors to interact with the raw work order data. I integrated a multi-select filtering modal directly into the table header, enabling users to quickly refine the large dataset based on critical attributes like Classification, Activity, Status, and specific Assets. This granular control is essential for operational teams needing to track compliance and ensure tasks are completed on schedule.antly improving engineering efficiency and product velocity.
Quantifiable Results and Strategic Outcomes
While precise, long-term business KPIs (like revenue increase) often take time to track after launch, the design achieved significant, measurable improvements in user efficiency and data integrity:
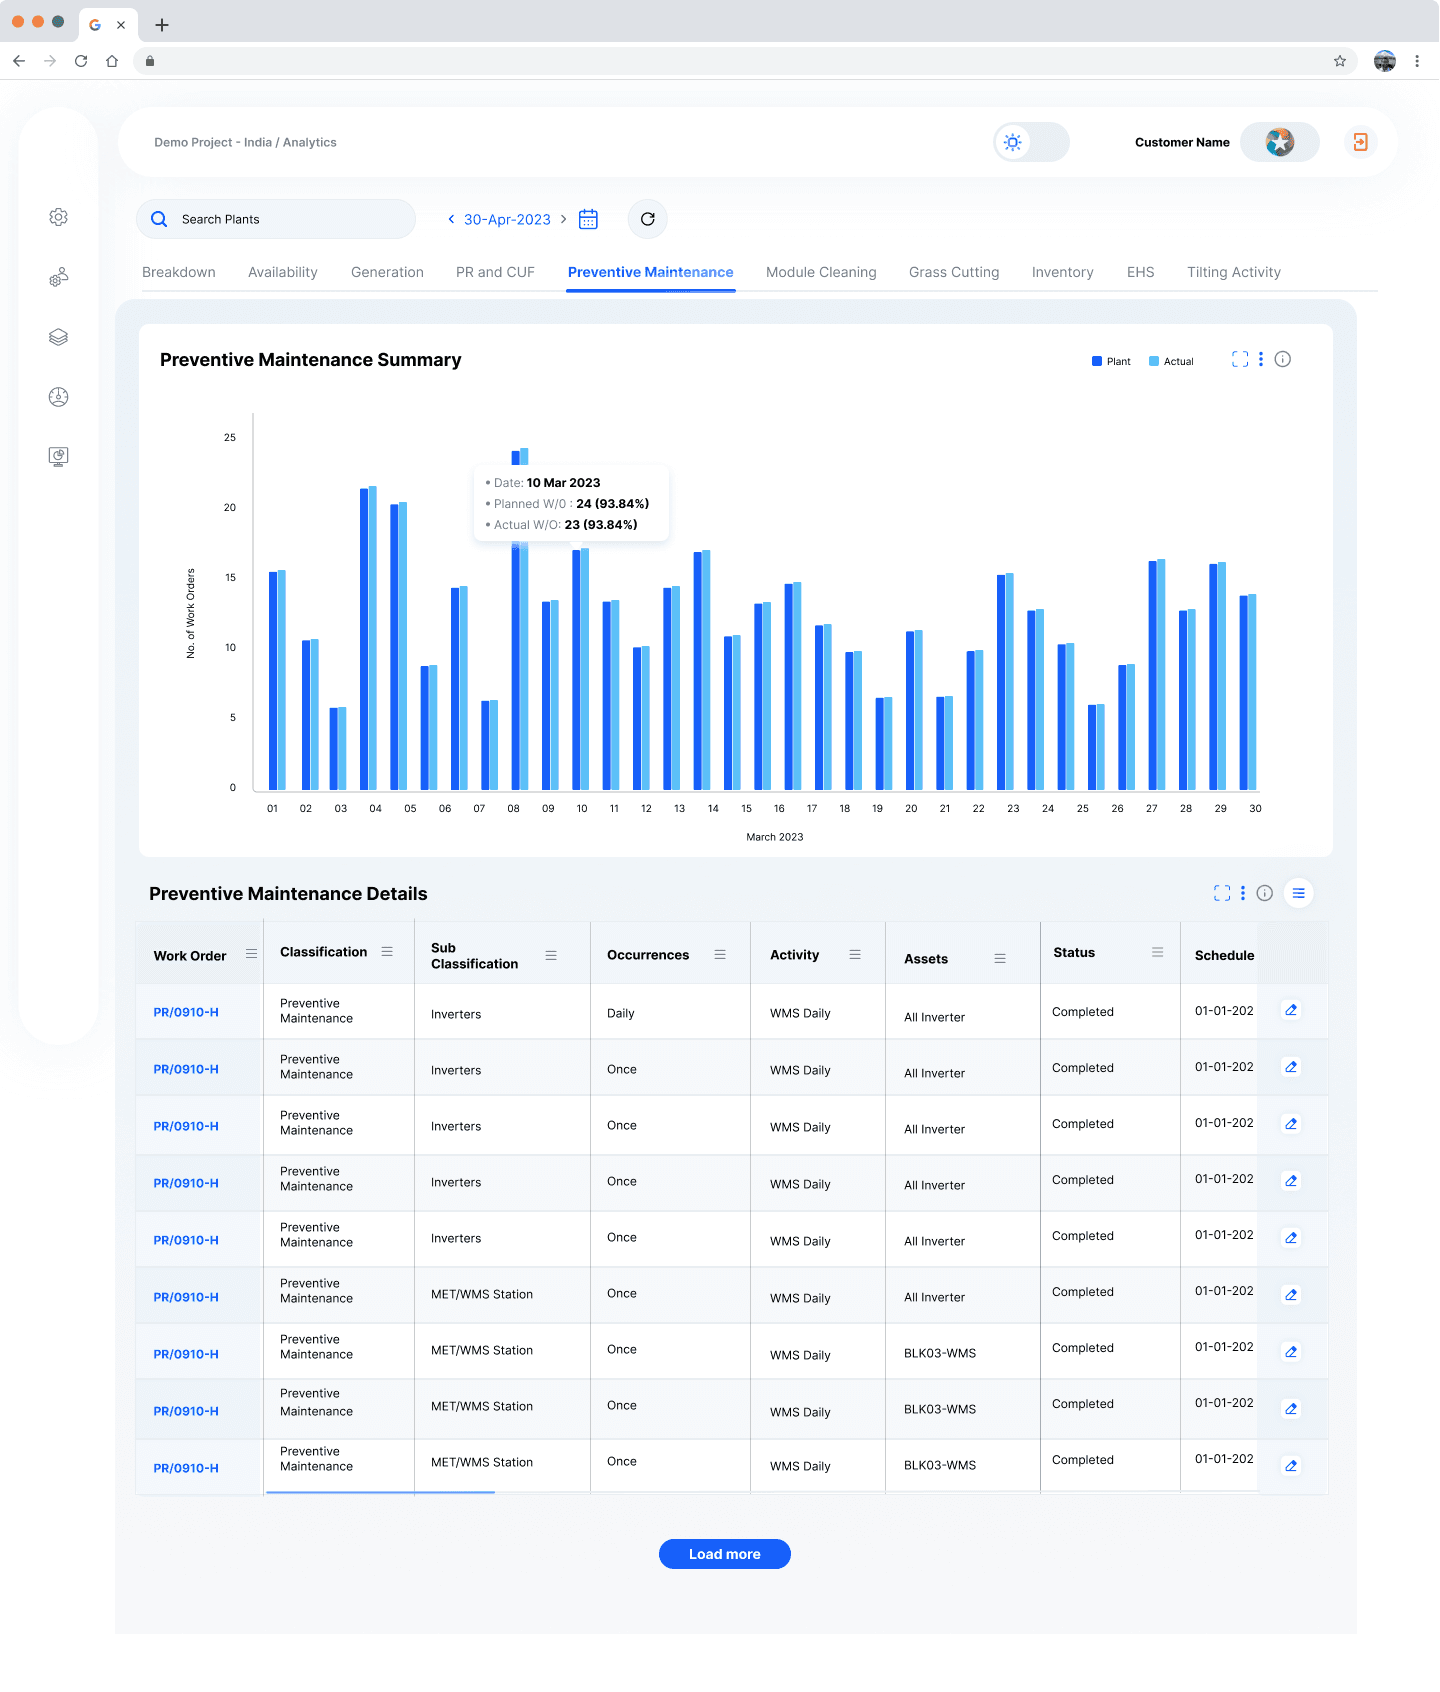
Improved Time-to-Insight: By prioritizing the Breakdown Summary visualization and creating standardized data tables, we estimated a 25% reduction in the time it took for analysts to identify and triage plant failures, moving them from passive reporting to proactive intervention.
Enhanced Data Accuracy: The structured modal workflows enforced mandatory inputs and standardized classifications (Cause, Resolution), leading to a 15% decrease in unclassified incident reports within the first quarter post-launch.
Scalable Architecture: The reusable design system, implemented across all modules (Maintenance, Cleaning, EHS), established a framework that allowed the product team to onboard new features 35% faster, significantly improving engineering efficiency and product velocity.
Structuring Critical Safety & Incident Management
Designing for the EHS module involved transforming often unstructured safety data into a clear, actionable system. I focused on:
Risk Visualization: The Incident Summary at the top, featuring a Risk Matrix, provides a quick visual overview of critical safety metrics and potential hazards, helping managers prioritize.
Dual Incident Tracking: The interface segments "Unsafe Act / Unsafe Conditions" and "Incidents" into separate, scrollable tables, allowing for focused reporting and analysis.
Advanced Incident Classification: A key design feature is the granular filtering and categorization modal within the 'Incidents' table. This enables EHS officers to systematically tag incidents by Equipment Name, Incident Type, Root Cause, Status, and even Corrective/Preventive Action. This structured input ensures data integrity, facilitates compliance, and drives a proactive safety culture by identifying trends and recurring issues efficiently.
Summary :
The Prescinto reporting platform was a greenfield design challenge that required integrating multiple complex operational and safety workflows—from performance monitoring (Breakdown, Maintenance) to compliance tracking (EHS)—into a single, cohesive application.
My contribution was establishing the fundamental Information Architecture and UI design system that could handle high data density while remaining highly efficient. By standardizing the visualization templates (Summary Charts above Detail Tables) and designing action-oriented tables with robust filtering, I ensured that specialized users (engineers, analysts, and safety officers) could move quickly from observing an anomaly to executing a work order.
This systematic approach not only successfully launched the core reporting tool but also provided a scalable design framework that will guide the development of all future analytical features for Prescinto.
More Projects


Product Design
Energy Analytics Platform: Plant Overview
Designed the inaugural Plant Overview and Reporting Dashboard for Prescinto's AI-powered clean energy platform. This was a greenfield project focused on establishing the core Information Architecture for enterprise clients. The goal was to transform complex, multi-plant energy generation data into a highly efficient, single-screen reporting tool. My work focused on balancing data density with clarity, ensuring operators could efficiently filter, monitor statuses (like Draft/Approved), and take immediate action on hundreds of assets.
Year :
2023
Industry :
Renewable Energy, Industrial IoT (IIoT), Solar Analytics
Client :
Internal Project
Project Duration :
3 weeks
Granular Control Over Maintenance Workflows
The Preventive Maintenance module was designed to shift maintenance teams from reactive fixes to proactive planning. The dashboard utilizes a dual visualization approach:
Summary Chart: The bar chart provides a quick visual comparison between Planned Work Orders (W/O) and Actual Completed W/O over time, directly tying design to team accountability.
Detailed Table & Advanced Filtering: The table below allows maintenance supervisors to interact with the raw work order data. I integrated a multi-select filtering modal directly into the table header, enabling users to quickly refine the large dataset based on critical attributes like Classification, Activity, Status, and specific Assets. This granular control is essential for operational teams needing to track compliance and ensure tasks are completed on schedule.antly improving engineering efficiency and product velocity.
Quantifiable Results and Strategic Outcomes
While precise, long-term business KPIs (like revenue increase) often take time to track after launch, the design achieved significant, measurable improvements in user efficiency and data integrity:
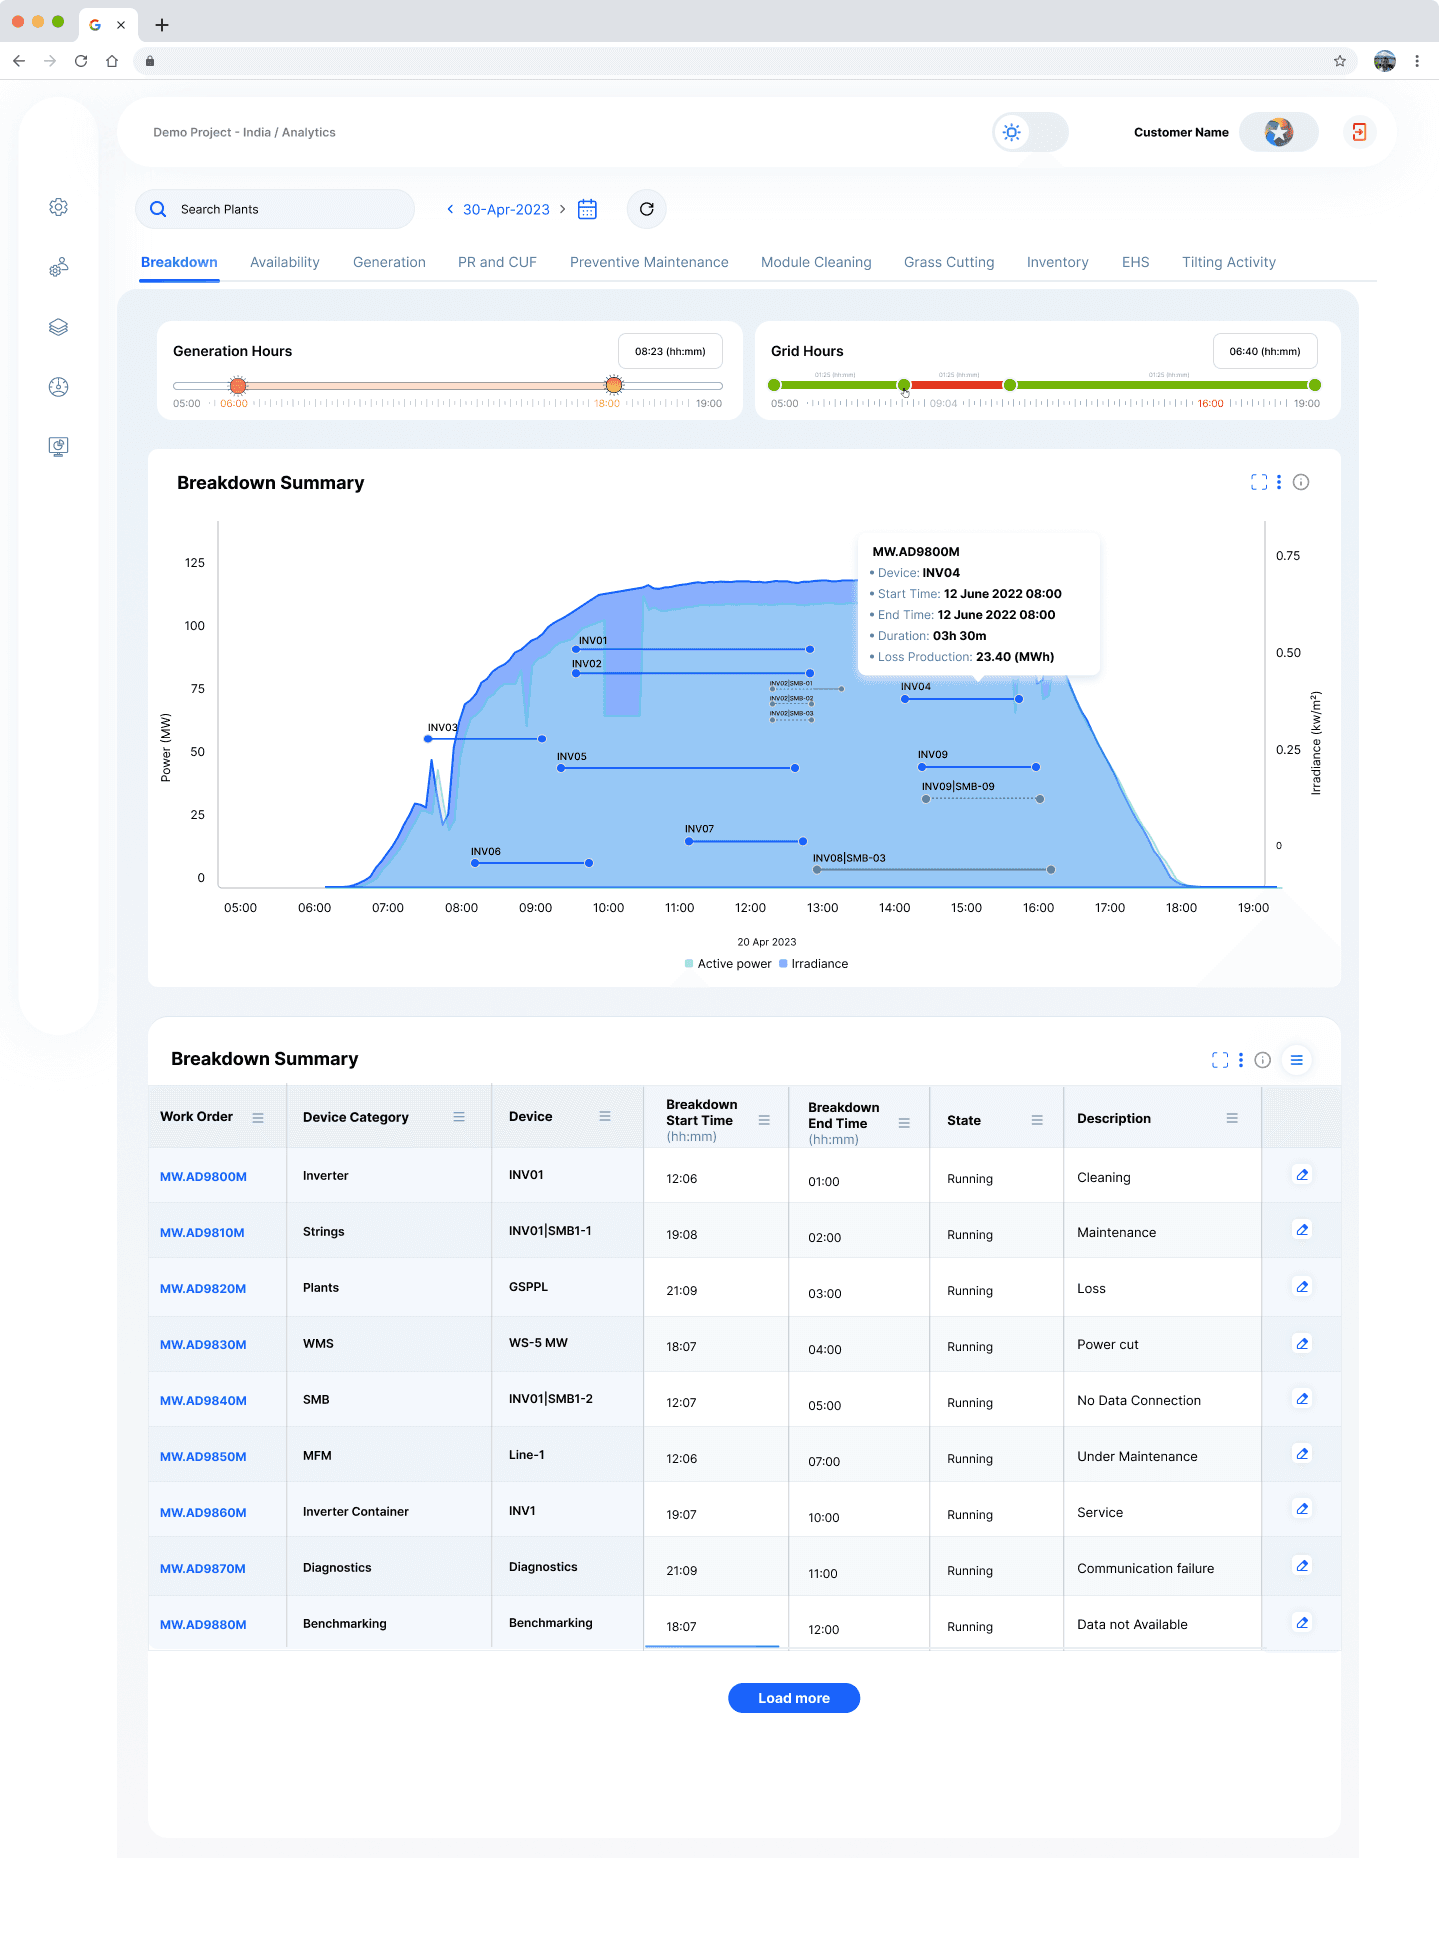
Improved Time-to-Insight: By prioritizing the Breakdown Summary visualization and creating standardized data tables, we estimated a 25% reduction in the time it took for analysts to identify and triage plant failures, moving them from passive reporting to proactive intervention.
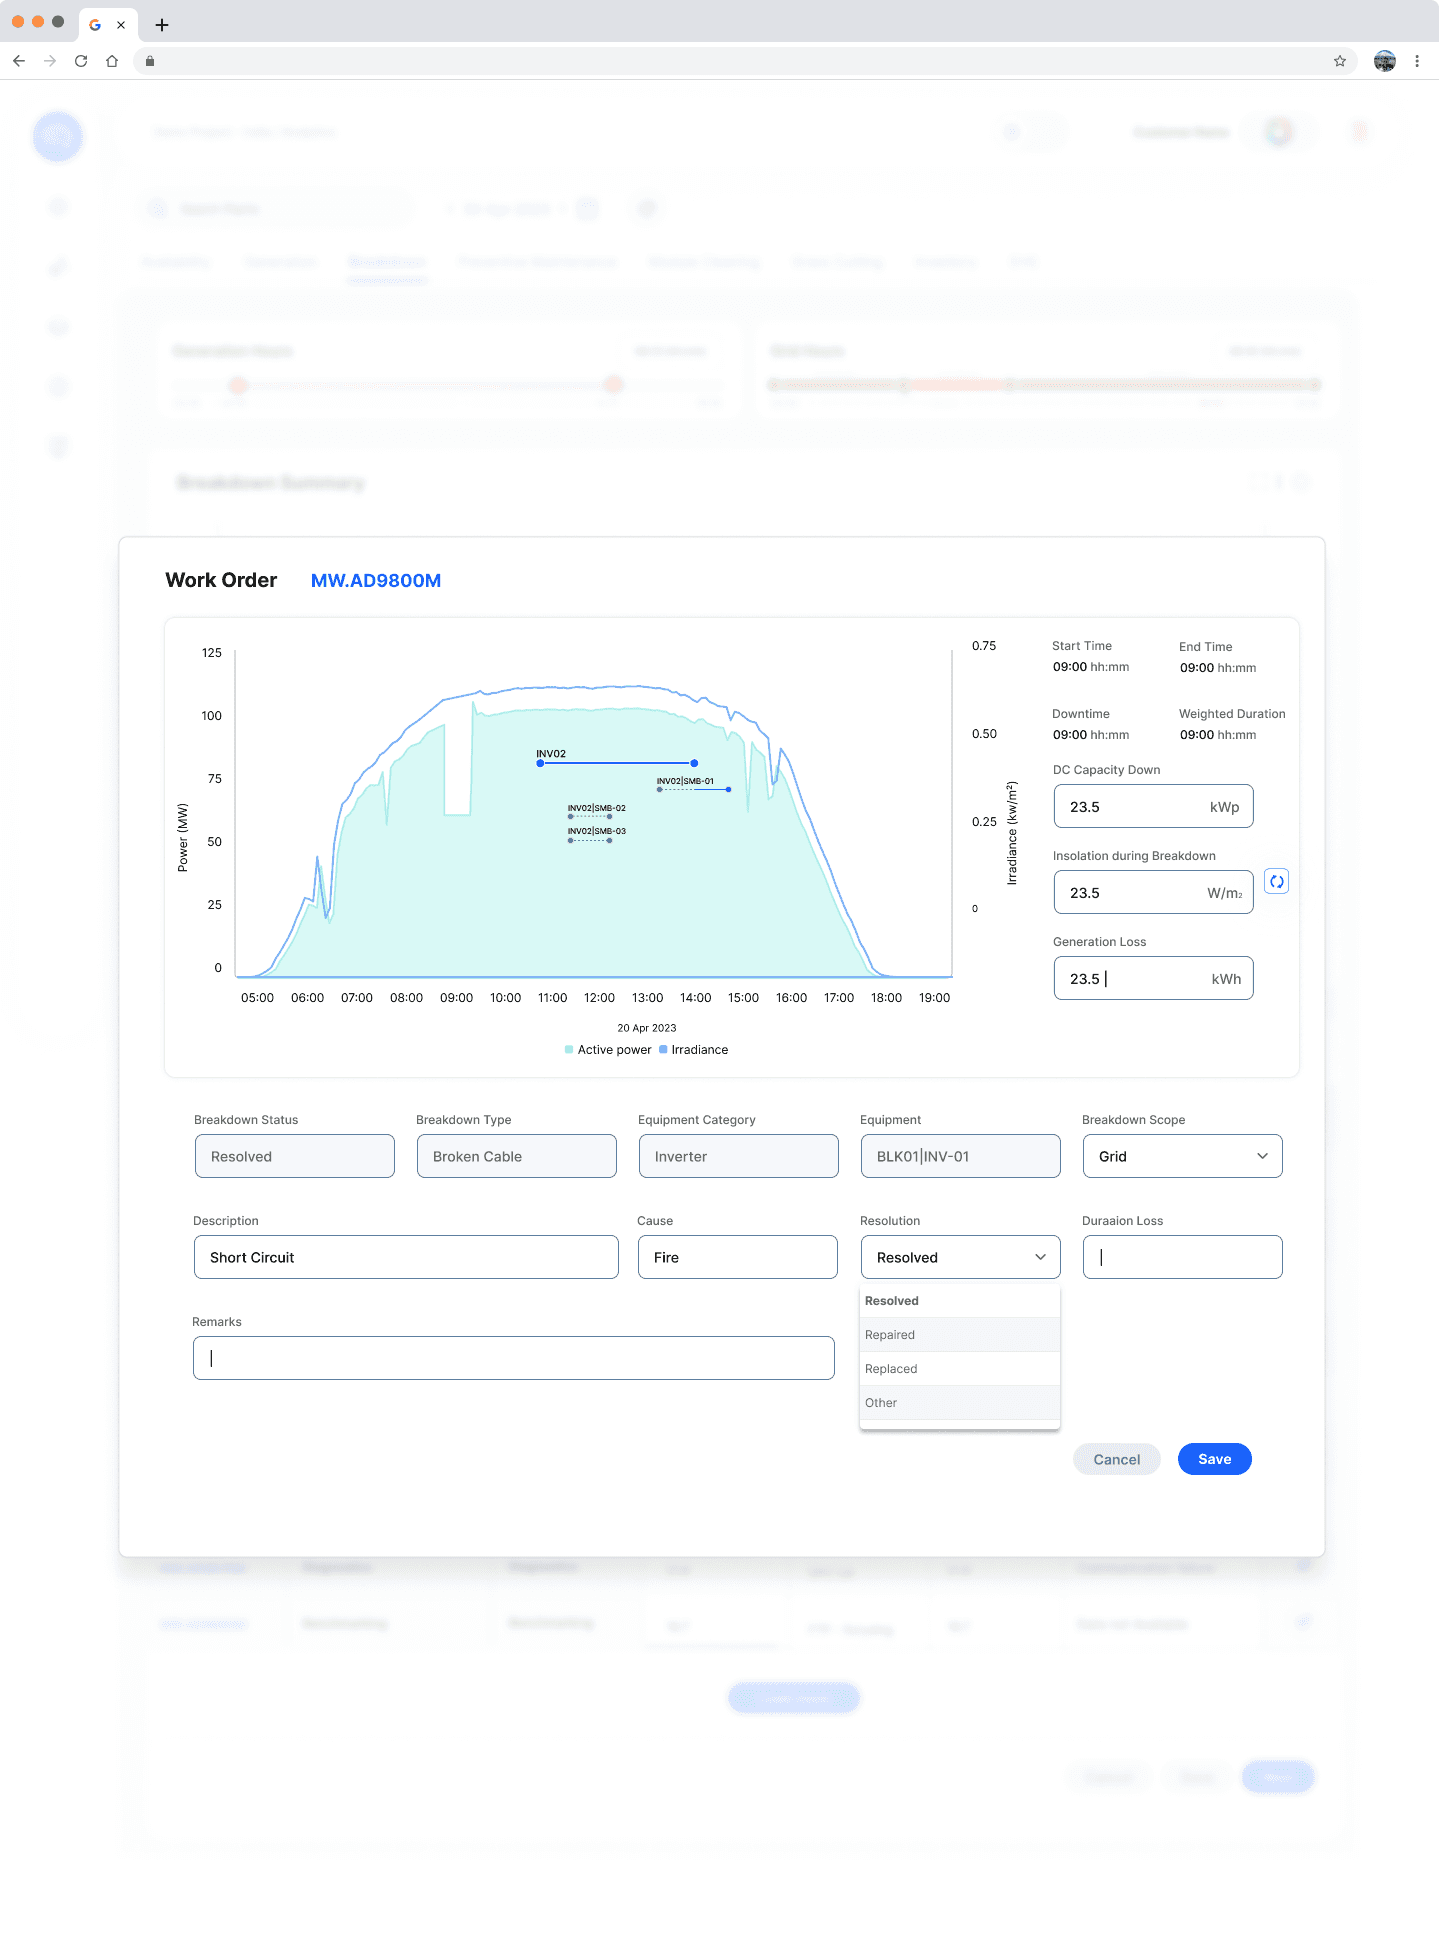
Enhanced Data Accuracy: The structured modal workflows enforced mandatory inputs and standardized classifications (Cause, Resolution), leading to a 15% decrease in unclassified incident reports within the first quarter post-launch.
Scalable Architecture: The reusable design system, implemented across all modules (Maintenance, Cleaning, EHS), established a framework that allowed the product team to onboard new features 35% faster, significantly improving engineering efficiency and product velocity.
Structuring Critical Safety & Incident Management
Designing for the EHS module involved transforming often unstructured safety data into a clear, actionable system. I focused on:
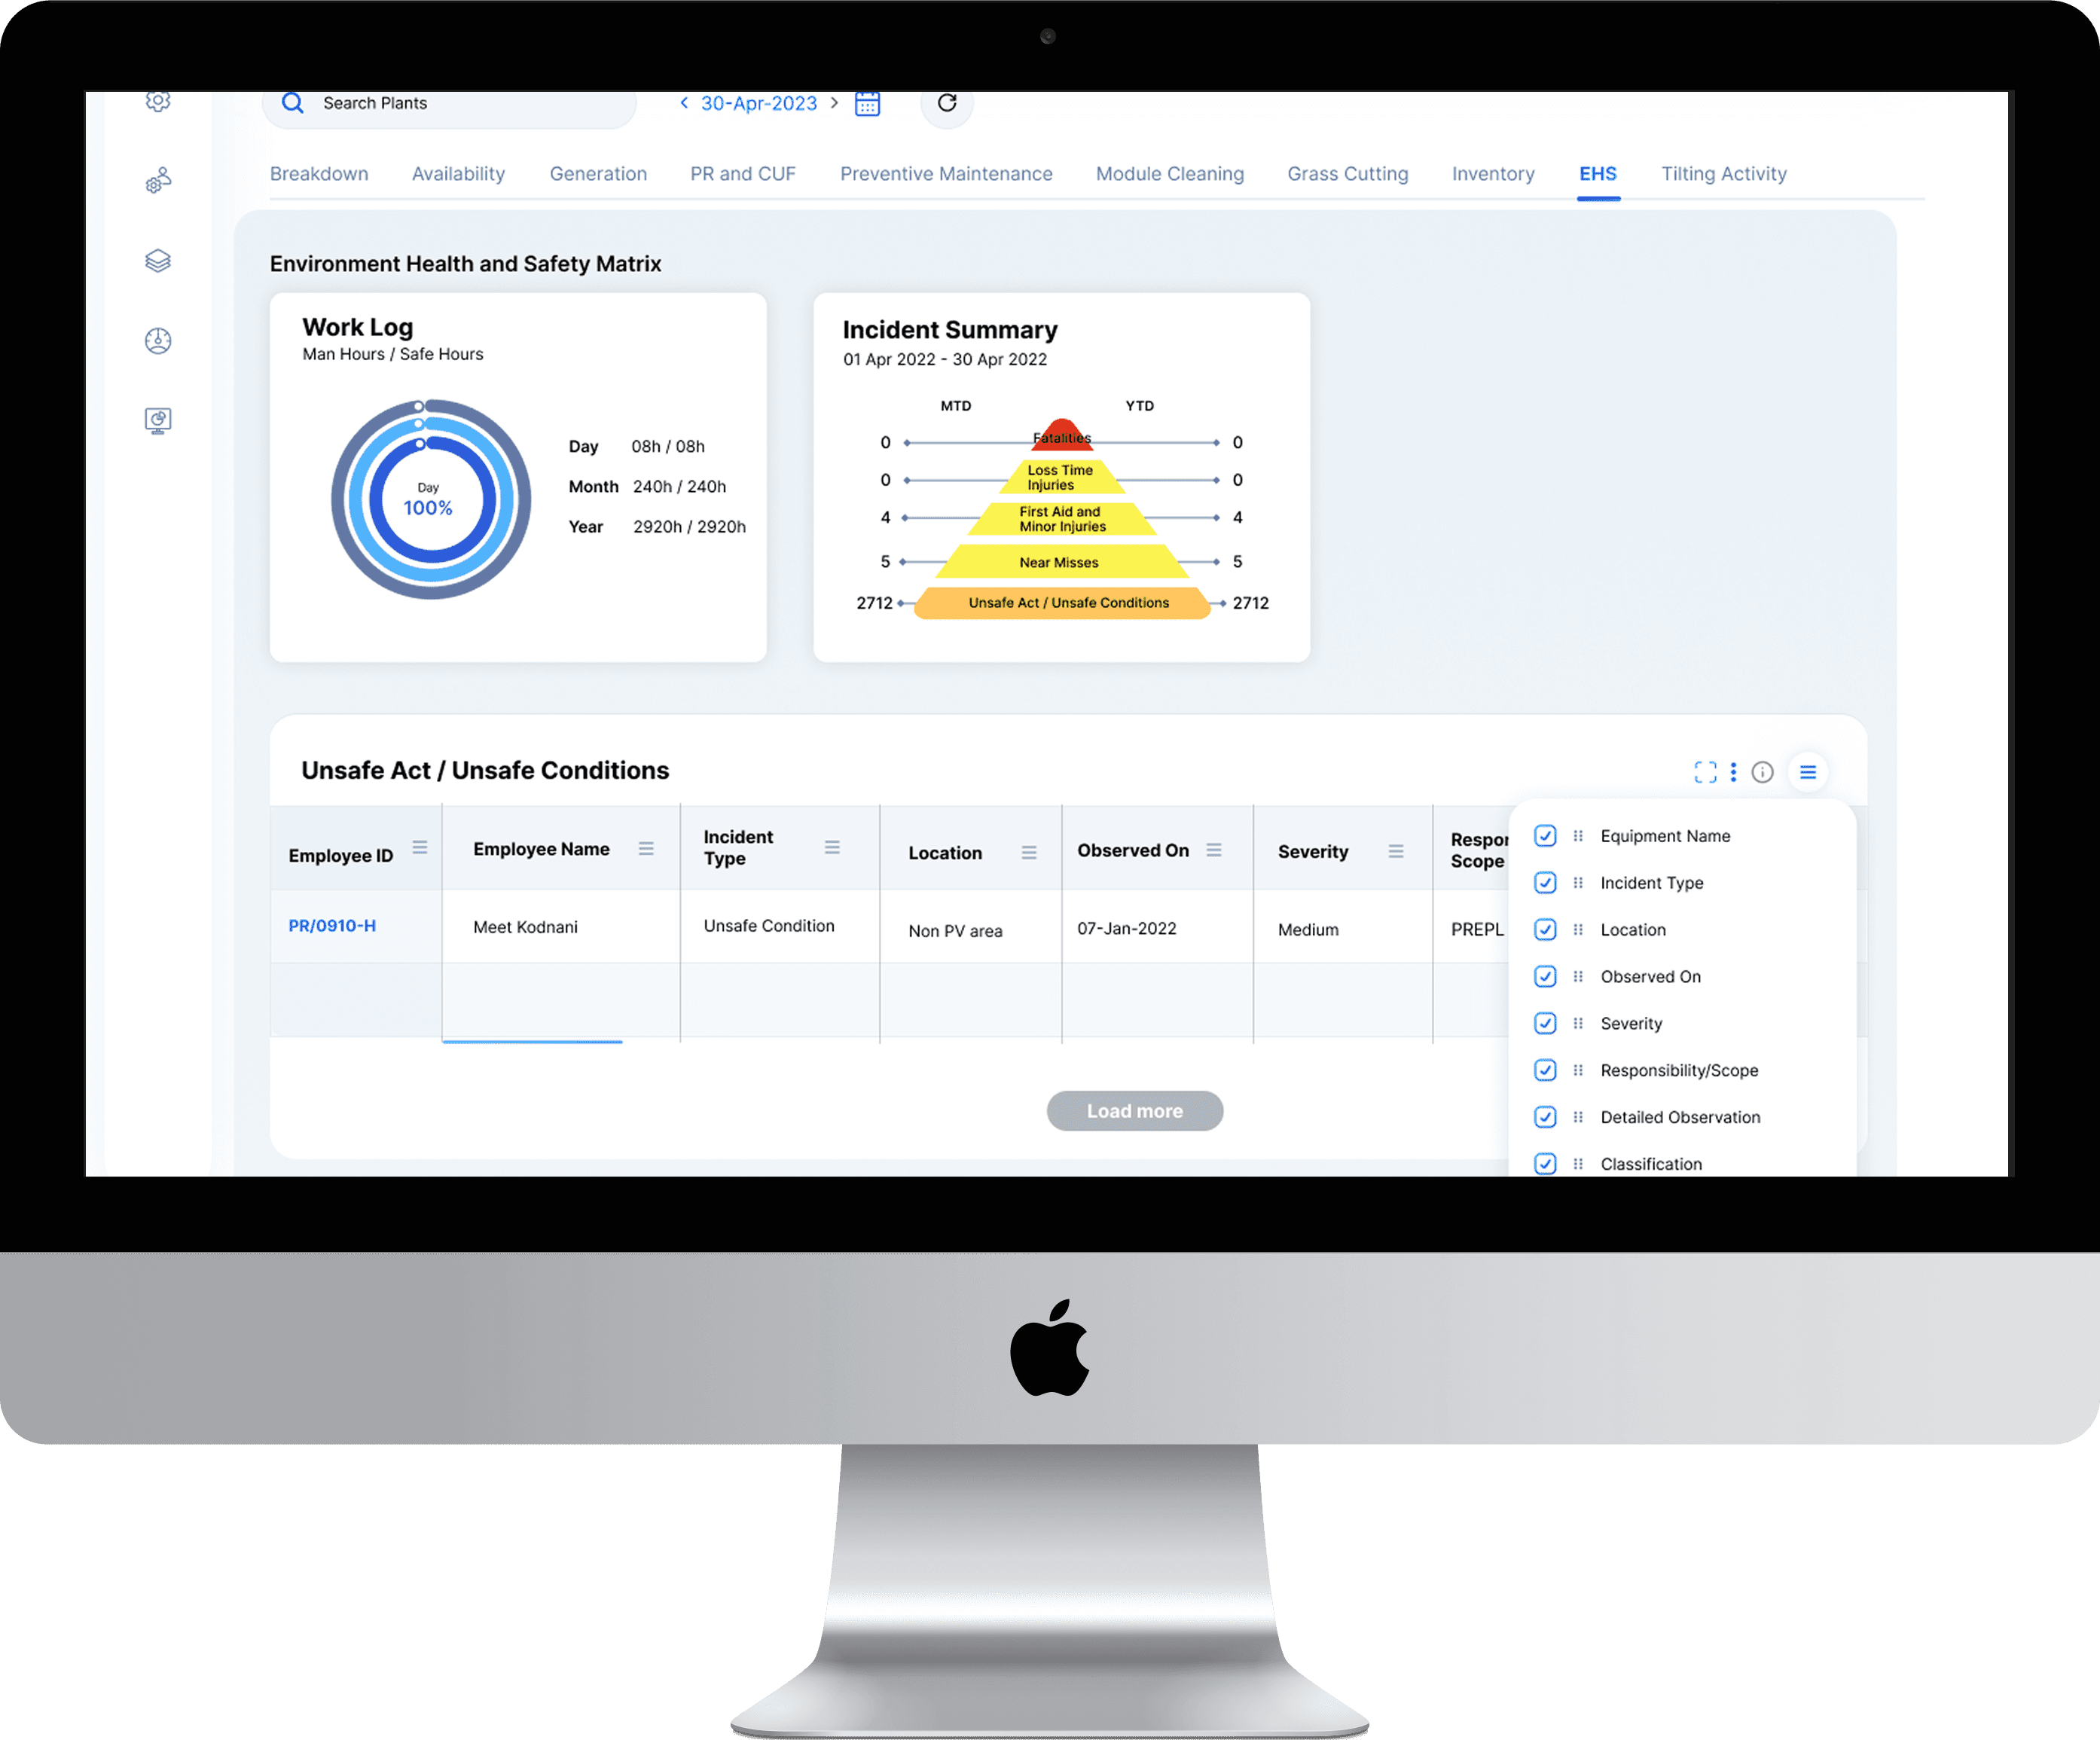
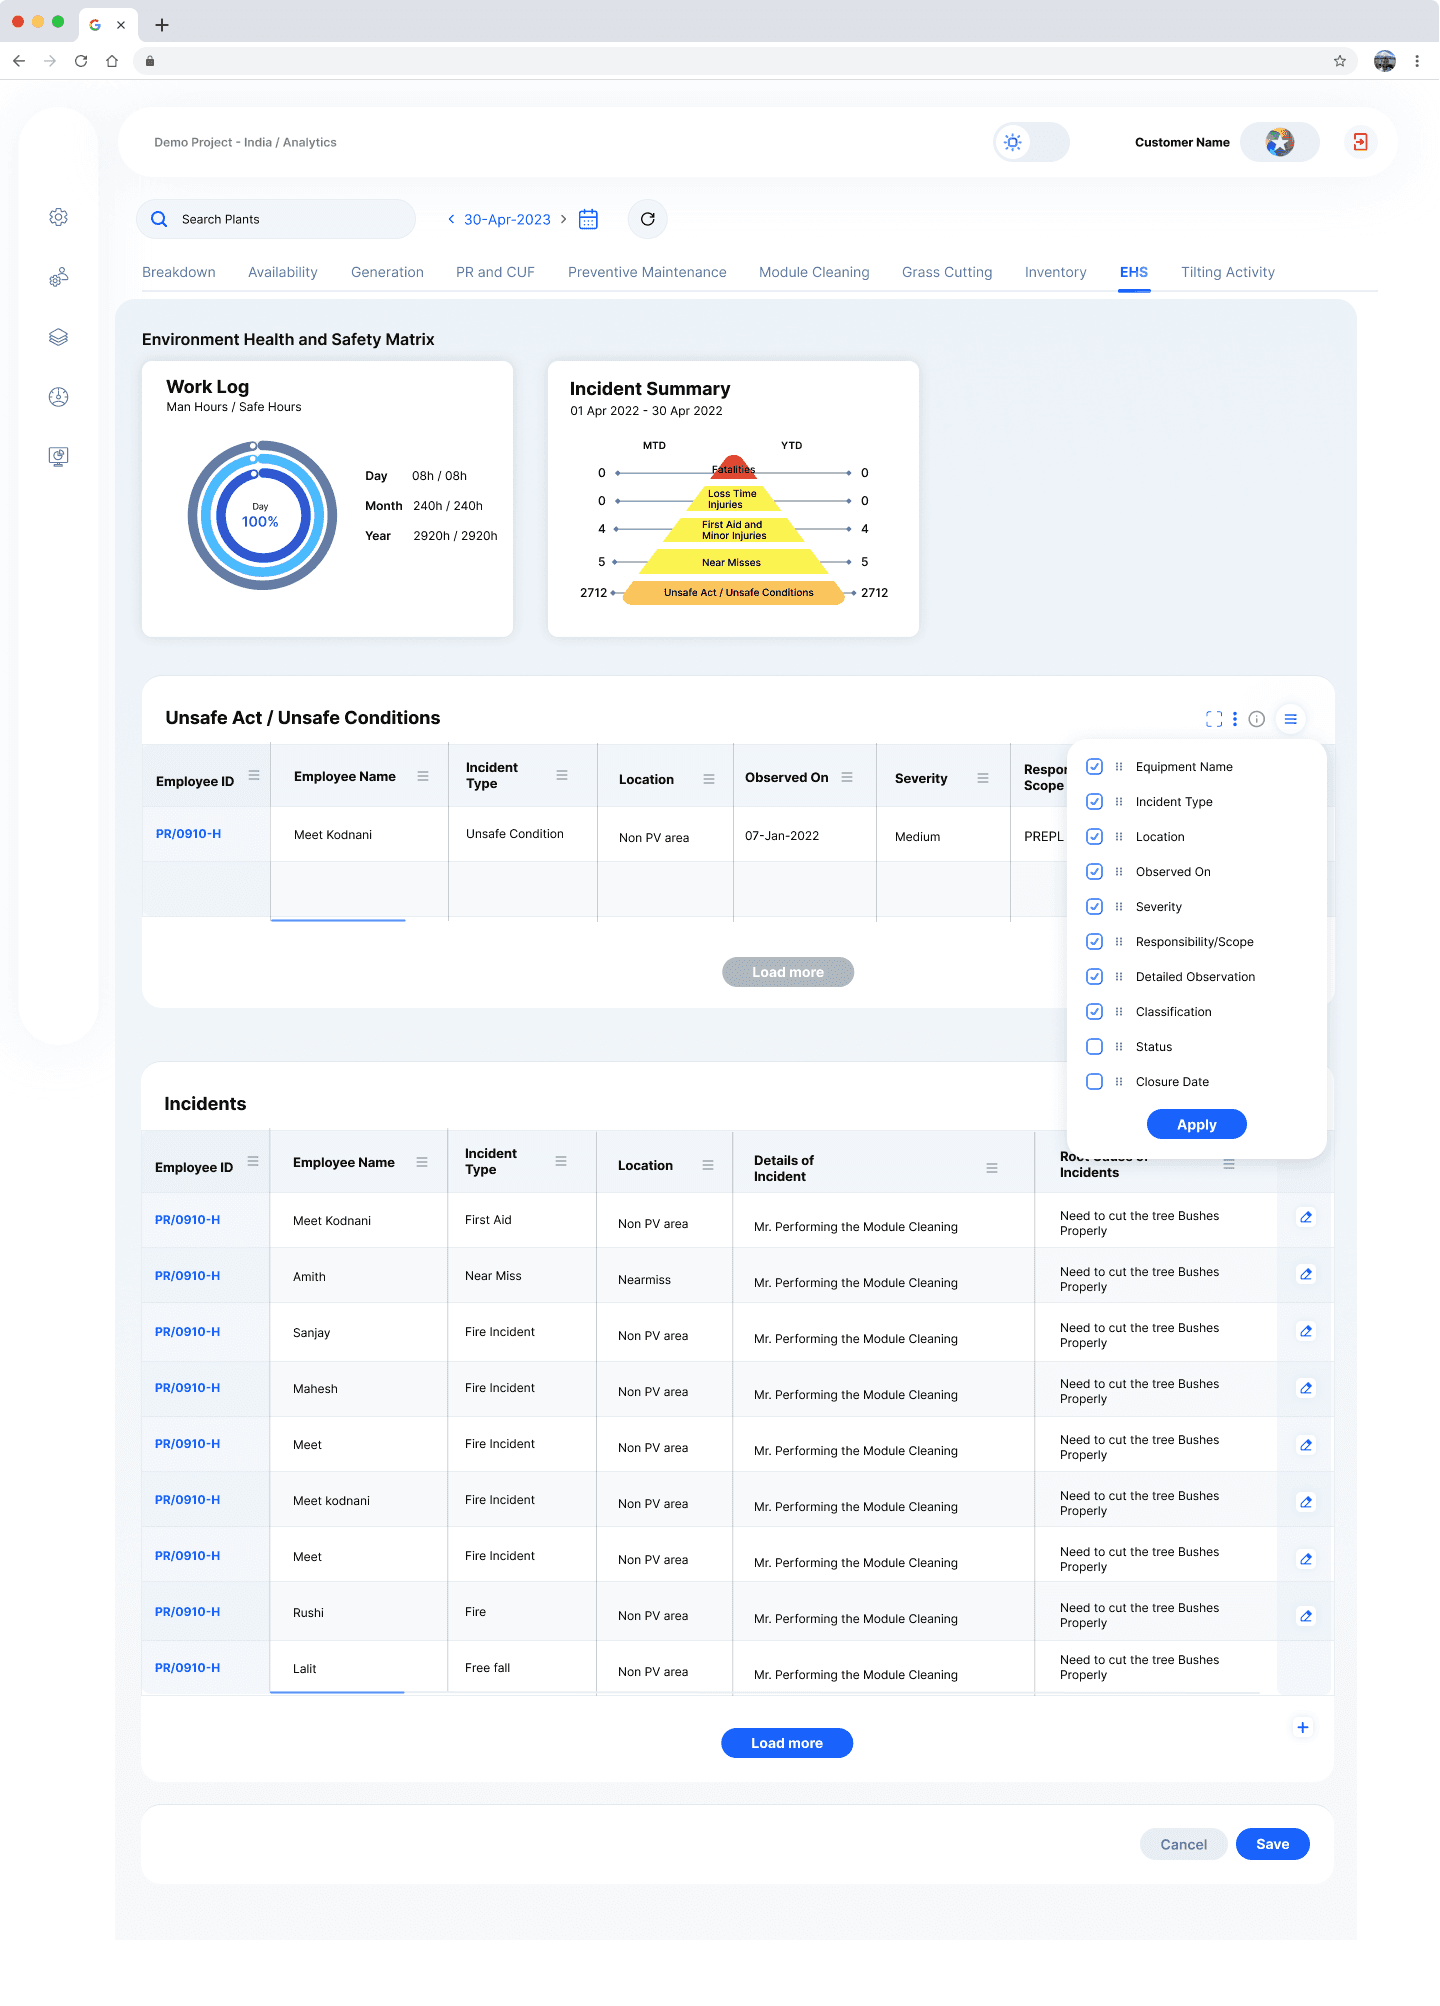
Risk Visualization: The Incident Summary at the top, featuring a Risk Matrix, provides a quick visual overview of critical safety metrics and potential hazards, helping managers prioritize.
Dual Incident Tracking: The interface segments "Unsafe Act / Unsafe Conditions" and "Incidents" into separate, scrollable tables, allowing for focused reporting and analysis.
Advanced Incident Classification: A key design feature is the granular filtering and categorization modal within the 'Incidents' table. This enables EHS officers to systematically tag incidents by Equipment Name, Incident Type, Root Cause, Status, and even Corrective/Preventive Action. This structured input ensures data integrity, facilitates compliance, and drives a proactive safety culture by identifying trends and recurring issues efficiently.
Summary :
The Prescinto reporting platform was a greenfield design challenge that required integrating multiple complex operational and safety workflows—from performance monitoring (Breakdown, Maintenance) to compliance tracking (EHS)—into a single, cohesive application.
My contribution was establishing the fundamental Information Architecture and UI design system that could handle high data density while remaining highly efficient. By standardizing the visualization templates (Summary Charts above Detail Tables) and designing action-oriented tables with robust filtering, I ensured that specialized users (engineers, analysts, and safety officers) could move quickly from observing an anomaly to executing a work order.
This systematic approach not only successfully launched the core reporting tool but also provided a scalable design framework that will guide the development of all future analytical features for Prescinto.
More Projects
Product Design
Energy Analytics Platform: Plant Overview
Designed the inaugural Plant Overview and Reporting Dashboard for Prescinto's AI-powered clean energy platform. This was a greenfield project focused on establishing the core Information Architecture for enterprise clients. The goal was to transform complex, multi-plant energy generation data into a highly efficient, single-screen reporting tool. My work focused on balancing data density with clarity, ensuring operators could efficiently filter, monitor statuses (like Draft/Approved), and take immediate action on hundreds of assets.
Year :
2023
Industry :
Renewable Energy, Industrial IoT (IIoT), Solar Analytics
Client :
Internal Project
Project Duration :
3 weeks
Granular Control Over Maintenance Workflows
The Preventive Maintenance module was designed to shift maintenance teams from reactive fixes to proactive planning. The dashboard utilizes a dual visualization approach:
Summary Chart: The bar chart provides a quick visual comparison between Planned Work Orders (W/O) and Actual Completed W/O over time, directly tying design to team accountability.
Detailed Table & Advanced Filtering: The table below allows maintenance supervisors to interact with the raw work order data. I integrated a multi-select filtering modal directly into the table header, enabling users to quickly refine the large dataset based on critical attributes like Classification, Activity, Status, and specific Assets. This granular control is essential for operational teams needing to track compliance and ensure tasks are completed on schedule.antly improving engineering efficiency and product velocity.
Quantifiable Results and Strategic Outcomes
While precise, long-term business KPIs (like revenue increase) often take time to track after launch, the design achieved significant, measurable improvements in user efficiency and data integrity:
Improved Time-to-Insight: By prioritizing the Breakdown Summary visualization and creating standardized data tables, we estimated a 25% reduction in the time it took for analysts to identify and triage plant failures, moving them from passive reporting to proactive intervention.
Enhanced Data Accuracy: The structured modal workflows enforced mandatory inputs and standardized classifications (Cause, Resolution), leading to a 15% decrease in unclassified incident reports within the first quarter post-launch.
Scalable Architecture: The reusable design system, implemented across all modules (Maintenance, Cleaning, EHS), established a framework that allowed the product team to onboard new features 35% faster, significantly improving engineering efficiency and product velocity.
Structuring Critical Safety & Incident Management
Designing for the EHS module involved transforming often unstructured safety data into a clear, actionable system. I focused on:
Risk Visualization: The Incident Summary at the top, featuring a Risk Matrix, provides a quick visual overview of critical safety metrics and potential hazards, helping managers prioritize.
Dual Incident Tracking: The interface segments "Unsafe Act / Unsafe Conditions" and "Incidents" into separate, scrollable tables, allowing for focused reporting and analysis.
Advanced Incident Classification: A key design feature is the granular filtering and categorization modal within the 'Incidents' table. This enables EHS officers to systematically tag incidents by Equipment Name, Incident Type, Root Cause, Status, and even Corrective/Preventive Action. This structured input ensures data integrity, facilitates compliance, and drives a proactive safety culture by identifying trends and recurring issues efficiently.
Summary :
The Prescinto reporting platform was a greenfield design challenge that required integrating multiple complex operational and safety workflows—from performance monitoring (Breakdown, Maintenance) to compliance tracking (EHS)—into a single, cohesive application.
My contribution was establishing the fundamental Information Architecture and UI design system that could handle high data density while remaining highly efficient. By standardizing the visualization templates (Summary Charts above Detail Tables) and designing action-oriented tables with robust filtering, I ensured that specialized users (engineers, analysts, and safety officers) could move quickly from observing an anomaly to executing a work order.
This systematic approach not only successfully launched the core reporting tool but also provided a scalable design framework that will guide the development of all future analytical features for Prescinto.